# 패키지 설치 (필요한 경우 주석 해제)# install.packages(c("httr", "jsonlite", "tidyverse", "leaflet"))# 패키지 로드library(httr)library(jsonlite)library(tidyverse)library(leaflet)# API 키 설정 (실제 사용 시 이 줄은 제거하고 .Renviron 파일에 키를 저장하세요)# 환경 변수에서 API 키 가져오기api_key <-Sys.getenv("OPENWEATHER_API_KEY")if (api_key =="") {stop("API keys not found. Please check your .Renviron file.")}
API 키 설정
OpenWeatherMap API를 사용하기 위해서는 API 키가 필요합니다. 보안을 위해 환경 변수를 사용하여 API 키를 관리합니다.
cities <-c("Seoul", "New York", "London", "Paris", "Tokyo", "Sydney", "Rio de Janeiro", "Cape Town", "Moscow")weather_data <-do.call(rbind, lapply(cities, get_weather, api_key = api_key))print(weather_data)
city lat lon temperature humidity wind_speed
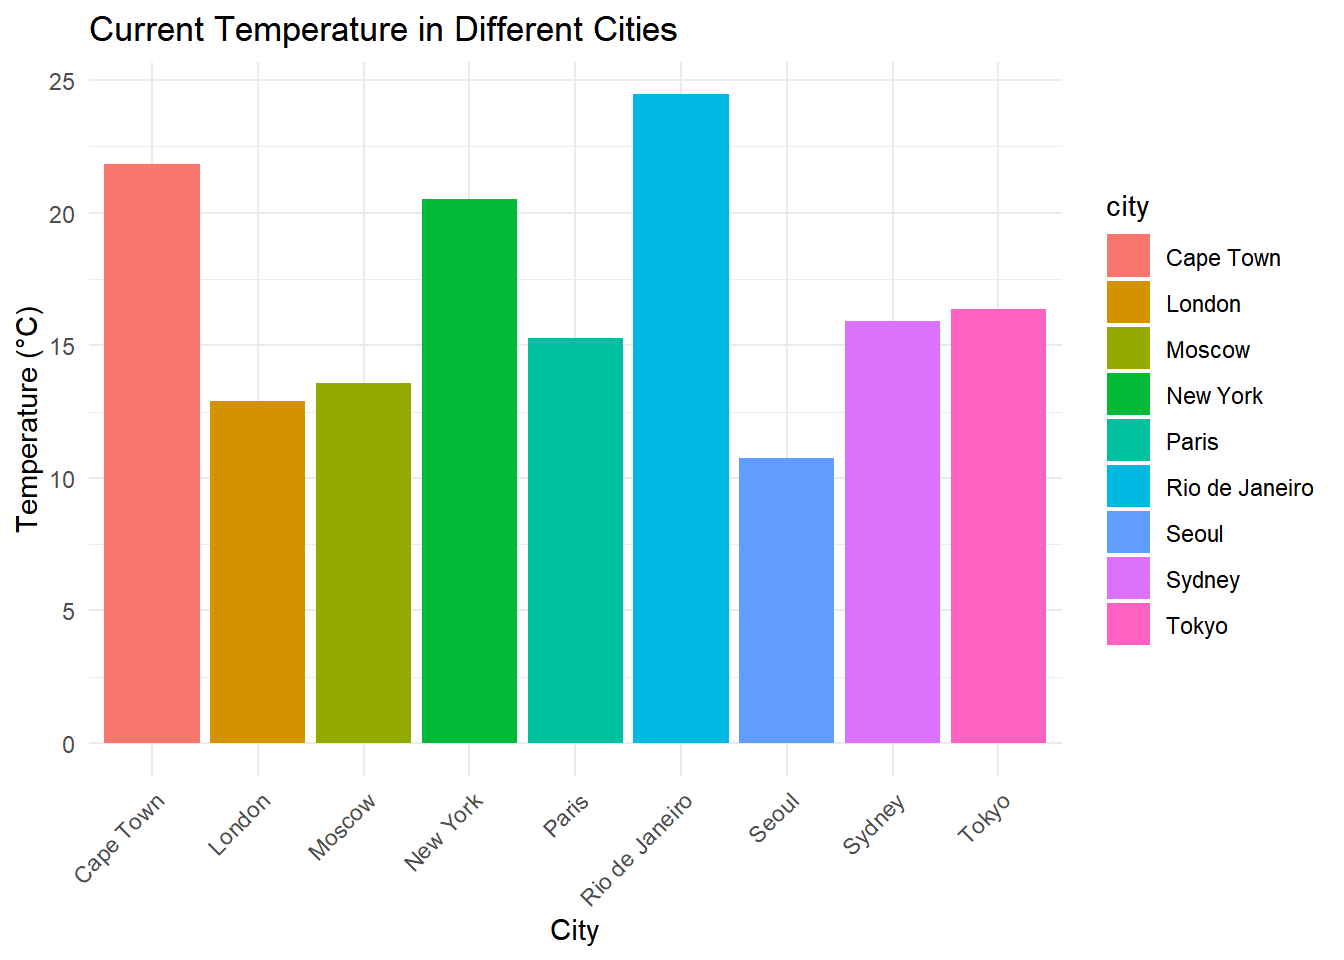
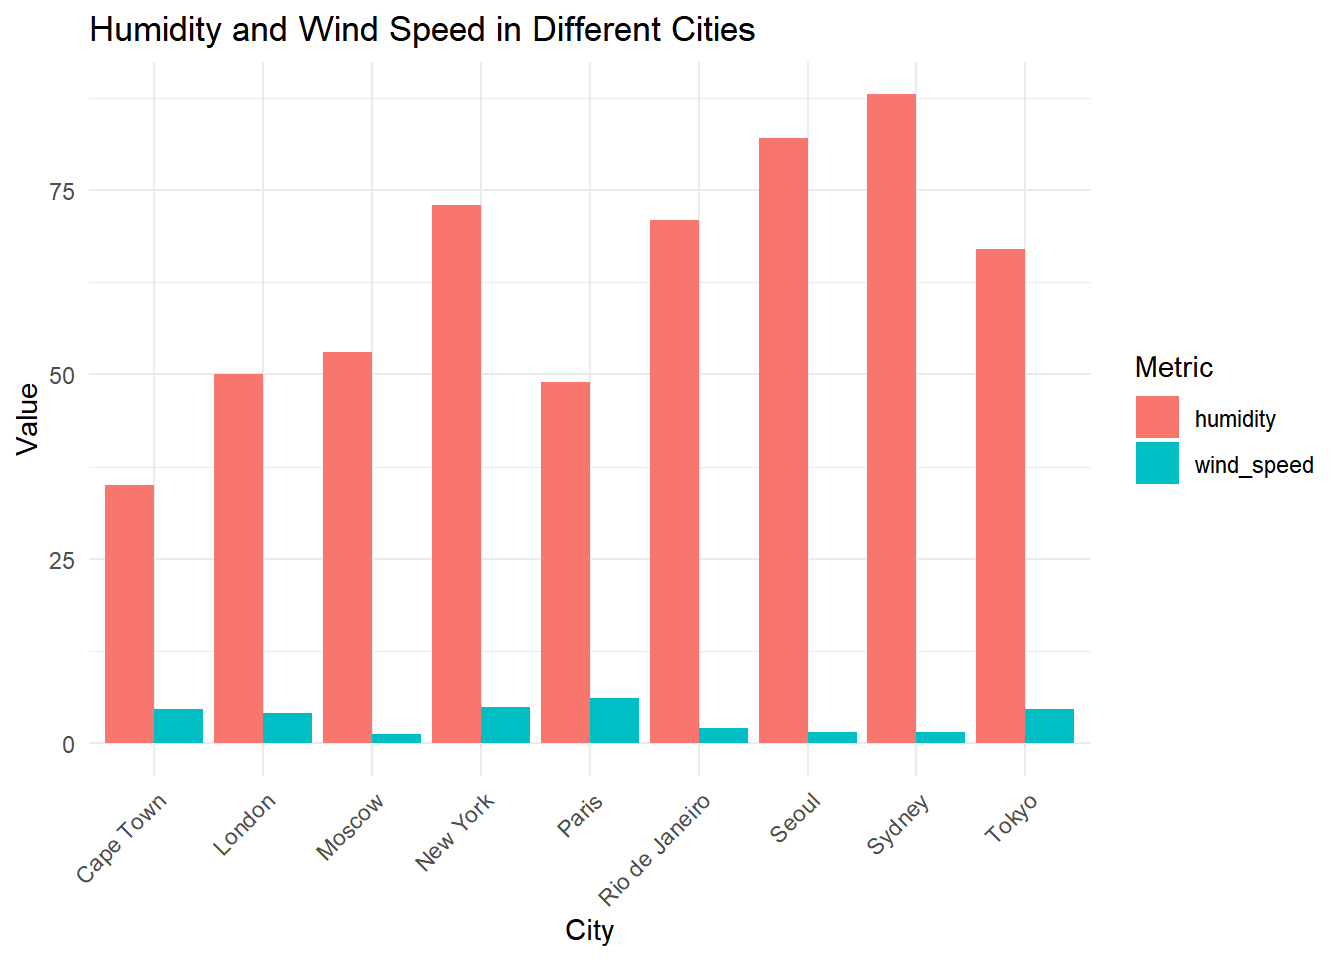
1 Seoul 37.5683 126.9778 10.76 82 1.54
2 New York 40.7143 -74.0060 20.53 73 4.92
3 London 51.5085 -0.1257 12.91 50 4.12
4 Paris 48.8534 2.3488 15.29 49 6.17
5 Tokyo 35.6895 139.6917 16.38 67 4.63
6 Sydney -33.8679 151.2073 15.91 88 1.54
7 Rio de Janeiro -22.9028 -43.2075 24.47 71 2.06
8 Cape Town -33.9258 18.4232 21.85 35 4.63
9 Moscow 55.7522 37.6156 13.59 53 1.20
데이터 시각화
도시별 기온 비교
Code
ggplot(weather_data, aes(x = city, y = temperature, fill = city)) +geom_bar(stat ="identity") +theme_minimal() +labs(title ="Current Temperature in Different Cities",x ="City", y ="Temperature (°C)") +theme(axis.text.x =element_text(angle =45, hjust =1))
도시별 습도와 풍속 비교
Code
weather_data_long <- weather_data %>%pivot_longer(cols =c(humidity, wind_speed), names_to ="metric", values_to ="value")ggplot(weather_data_long, aes(x = city, y = value, fill = metric)) +geom_bar(stat ="identity", position ="dodge") +theme_minimal() +labs(title ="Humidity and Wind Speed in Different Cities",x ="City", y ="Value", fill ="Metric") +theme(axis.text.x =element_text(angle =45, hjust =1))
추가 분석
평균 기온을 계산하고, 가장 더운 도시와 가장 추운 도시를 찾아봅니다.
Code
mean_temp <-mean(weather_data$temperature)print(paste("Average temperature across all cities:", round(mean_temp, 2), "°C"))
[1] "Average temperature across all cities: 16.85 °C"
이 문서에서는 OpenWeatherMap API를 사용하여 실시간 날씨 데이터를 수집하고, 이를 다양한 방식으로 시각화하는 방법을 살펴보았습니다. 이러한 기술은 데이터 분석, 기상 연구, 여행 계획 등 다양한 분야에서 활용될 수 있습니다.
Source Code
---title: "OpenWeatherMap API를 이용한 날씨 분석"author: "waterfirst"date: "`r Sys.Date()`"format: html: toc: true code-fold: show code-tools: trueexecute: echo: true warning: false---## 소개이 문서에서는 OpenWeatherMap API를 사용하여 여러 도시의 날씨 데이터를 수집하고 분석하는 방법을 알아봅니다. R 언어와 다양한 패키지를 사용하여 데이터를 시각화하고, 인터랙티브한 지도를 만들어 볼 것입니다.먼저 아래 사이트에서 가입 후 api key를 발급받습니다.[OpenWeatherMap](https://home.openweathermap.org/users/sign_up)## 필요한 패키지 설치 및 로드```{r setup}#| message: false# 패키지 설치 (필요한 경우 주석 해제)# install.packages(c("httr", "jsonlite", "tidyverse", "leaflet"))# 패키지 로드library(httr)library(jsonlite)library(tidyverse)library(leaflet)# API 키 설정 (실제 사용 시 이 줄은 제거하고 .Renviron 파일에 키를 저장하세요)# 환경 변수에서 API 키 가져오기api_key <- Sys.getenv("OPENWEATHER_API_KEY")if (api_key == "") { stop("API keys not found. Please check your .Renviron file.")}```## API 키 설정OpenWeatherMap API를 사용하기 위해서는 API 키가 필요합니다. 보안을 위해 환경 변수를 사용하여 API 키를 관리합니다.```{r api_key}#| eval: false```## 날씨 데이터 수집 함수 정의API를 통해 날씨 데이터를 수집하는 함수를 정의합니다.```{r get_weather_function}get_weather <- function(city, api_key) { encoded_city <- URLencode(city, reserved = TRUE) url <- paste0("https://api.openweathermap.org/data/2.5/weather?q=", encoded_city, "&appid=", api_key, "&units=metric") response <- GET(url) if (status_code(response) == 200) { content <- content(response, "text") data <- fromJSON(content) return(data.frame( city = city, lat = data$coord$lat, lon = data$coord$lon, temperature = data$main$temp, humidity = data$main$humidity, wind_speed = data$wind$speed )) } else { warning(paste("Failed to fetch data for", city)) return(NULL) }}```## 데이터 수집여러 도시의 날씨 데이터를 수집합니다.```{r collect_data}cities <- c("Seoul", "New York", "London", "Paris", "Tokyo", "Sydney", "Rio de Janeiro", "Cape Town", "Moscow")weather_data <- do.call(rbind, lapply(cities, get_weather, api_key = api_key))print(weather_data)```## 데이터 시각화### 도시별 기온 비교```{r temp_comparison}ggplot(weather_data, aes(x = city, y = temperature, fill = city)) + geom_bar(stat = "identity") + theme_minimal() + labs(title = "Current Temperature in Different Cities", x = "City", y = "Temperature (°C)") + theme(axis.text.x = element_text(angle = 45, hjust = 1))```### 도시별 습도와 풍속 비교```{r humidity_wind_comparison}weather_data_long <- weather_data %>% pivot_longer(cols = c(humidity, wind_speed), names_to = "metric", values_to = "value")ggplot(weather_data_long, aes(x = city, y = value, fill = metric)) + geom_bar(stat = "identity", position = "dodge") + theme_minimal() + labs(title = "Humidity and Wind Speed in Different Cities", x = "City", y = "Value", fill = "Metric") + theme(axis.text.x = element_text(angle = 45, hjust = 1))```## 추가 분석평균 기온을 계산하고, 가장 더운 도시와 가장 추운 도시를 찾아봅니다.```{r additional_analysis}mean_temp <- mean(weather_data$temperature)print(paste("Average temperature across all cities:", round(mean_temp, 2), "°C"))hottest_city <- weather_data[which.max(weather_data$temperature), "city"]coldest_city <- weather_data[which.min(weather_data$temperature), "city"]print(paste("Hottest city:", hottest_city))print(paste("Coldest city:", coldest_city))```## 인터랙티브 지도 시각화Leaflet을 사용하여 각 도시의 날씨 정보를 지도 위에 표시합니다.```{r leaflet_map}# 팝업 내용 생성weather_data$popup_content <- paste0( "<strong>", weather_data$city, "</strong><br>", "Temperature: ", round(weather_data$temperature, 1), "°C<br>", "Humidity: ", weather_data$humidity, "%<br>", "Wind Speed: ", round(weather_data$wind_speed, 1), " m/s")# 아이콘 생성 함수get_weather_icon <- function(temp) { if (temp < 0) return("❄️") else if (temp < 10) return("☁️") else if (temp < 20) return("⛅") else if (temp < 30) return("☀️") else return("🔥")}weather_data$icon <- sapply(weather_data$temperature, get_weather_icon)# Leaflet 지도 생성leaflet(weather_data) %>% addTiles() %>% # OpenStreetMap 타일 추가 addMarkers( ~lon, ~lat, popup = ~popup_content, label = ~paste(city, icon) )```## 결론이 문서에서는 OpenWeatherMap API를 사용하여 실시간 날씨 데이터를 수집하고, 이를 다양한 방식으로 시각화하는 방법을 살펴보았습니다. 이러한 기술은 데이터 분석, 기상 연구, 여행 계획 등 다양한 분야에서 활용될 수 있습니다.